Now let’s turn our attention to the Field Explorer on the right side of the main designer window. If it is not already visible, on the main menu bar, click View then Field Explorer.
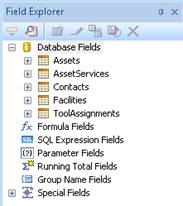
Expand Assets and select cID. A box will appear on your cursor when moved out of the Field Explorer box. Move your cursor to the Details Section of your report and place it where you want the data to show on your report and click the mouse button. If you placed the data box in the Details Section an automatic heading will appear with cID in the heading. We will adjust the headings once all the fields have been added to the report. Now proceed with the other data fields for the report.
It may be necessary to change the size of the data fields. Left-click to highlight the field, then move the mouse cursor to the small resizing handle on one of the ends of the highlighted box. The mouse cursor will change into a double arrow. Hold down the left mouse button and change the size of the field. Do the same for the respective heading. Better yet, select both field and heading (left-click while holding the CTRL key), to resize both at the same time.
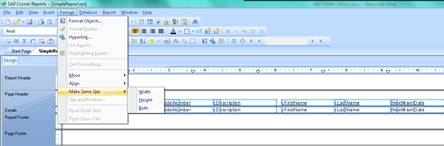
On the main menu, under Format, there are several options to re-arrange the fields. Select the fields you want to re-arrange by holding the CRTL key and left-clicking with the mouse (select all by pressing CTRL+A) and explore the options on the Format menu, Align and Make Same Size.
Since the selected fields are rather large, it may be best to change the report orientation to Landscape format. To do that, go to Page Setup on the File menu and change the Orientation to Landscape.
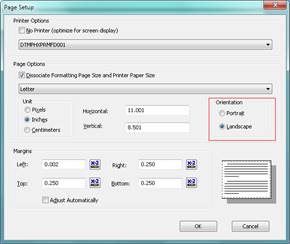
Keep in mind that these options may vary, depending on the printer selected.
Let’s take a look at what the report will look like at this point. Do this by pressing the F5 key, to preview the report. The report will appear just the way it would be if printed at this point. In Preview mode, you may also move the data around by highlighting the data field and holding down the left mouse button, drag the data field to where you wish it and let go.
Changing the column headers from their default database field names to more user friendly descriptions is something we had planned to do but not yet done. The report preview is the perfect place to adjust the headings, since we will see right away how it will be printed later. Right-click each heading and select Edit Text. Alternately, left-click the heading and press F2.
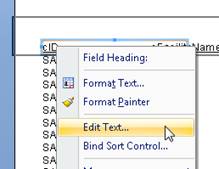
Now type the new heading for each field, Asset ID, Manufacturer, Model, Description, First Name, Last Name and Cal Due Date. To change font, color, bold, etc. select the Format Text option from the right-click menu instead.
Now let’s add a title to the report. We can add text in two ways:
·
Type the text
directly onto the report.
·
Insert a text
object.
For this example, we will insert a text object. To insert a text object, click Insert on the main Menu and choose Text Object. Move the cursor to position the text object in the Header section then click. Type in: Assets Due For Calibration. When finished, Click anywhere off the edit text object box. Note: It is easier to do this in design mode.
Now we have a basic Assets Due for Calibration report. Let’s spend some time formatting the fields so that they are presentation quality. Let’s begin by formatting the report title. We need to expand the title size to the width of the report.
1.
Increase the font
size of the title to 14 point by clicking on the font size down arrow.
2.
Click the Report
Title field to select it.
3.
Position your
cursor on the right edge of the field box until you get a double-arrow resizing
cursor.
4.
Drag the right
edge of the field box until it is even with the right edge of the data in the
right column in the Preview Window. You may need to release the field box,
scroll the window to the right, and then continue expanding the field box until
it is even with the right edge of the column.
5.
Scroll to the
left edge of the Preview Window when finished. What you have done now is
created a large field that extends from the left edge to the right edge of your
report. Now we’re going to center align the title in that field so it will
automatically be centered above your report date.
6.
At the bottom of
the window is the Format Bar. Click (the center alignment button) to center the
report title inside the text field.
To format a field, right-click on the field and a pop-up menu will appear. Use Format Text… to change the font, font size, style, effects, border and/or color for selected elements on the report.
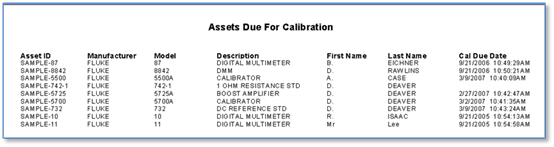
Our report should look something like this:
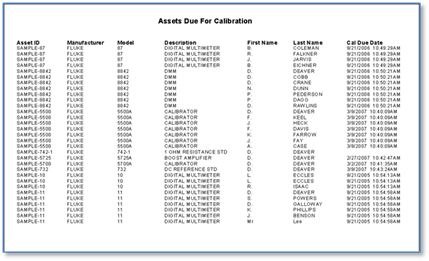
The report we just created shows all of the data from the tables joined together in our query, which yields multiple records per Asset, due to inactive records that need to be excluded from the result set.
Crystal Reports provides two options for selecting records:
·
Select Records
Expert, which we are going to use here, and
·
Edit Record
Selection Formula, which is covered later.
The Select Records Expert is a straightforward way to create a record selection expression. It will guide us through the creation process. There are three ways to access the Select Records option:
·
Select a field
and click the right mouse button to reveal a pop-up menu. Choose Select Expert
Record… from the menu.
·
Choose Selection
Formulas, Record from the Report menu. The Formula Workshop Record Selection
Formulas Editor dialog box will appear.
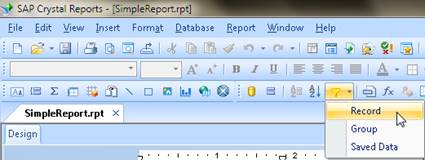
·
Click the Select
Expert dropdown on the button bar and select Record.
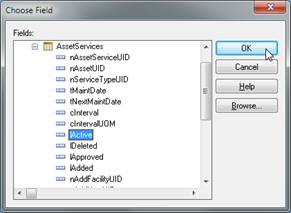
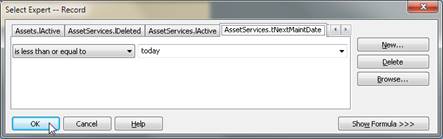
For each table in the report, first select the lActive field, select is not equal to and enter 0; then select the lDeleted field, select is equal to and enter 0. Press the New… button on the Select Expert to navigate to the next field.
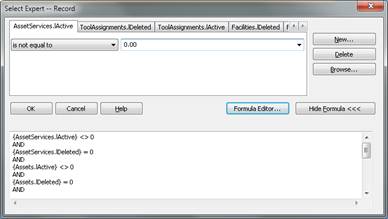
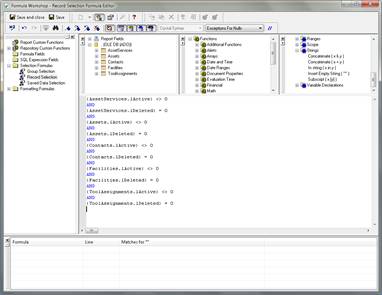
We can also enter all the filters in the Formula Workshop. To repeat, we want to exclude all records that are inactive or deleted. lActive on each record should not be 0 and lDeleted on each record should be 0:
Finally, let’s make sure the cal due dates aren’t in the future, by limiting AssetServices.tNextMaintDate to dates less or equal to today.
Now, the report is reduced to the relevant data set:
So far we have selected specific information for our report using record selection, but it is presented to us in the order which it is stored in the database. We can group information by report fields or even by fields that are not on the report. We would like to group information in this report by the contact and within that, sort the records by due date, then by model.
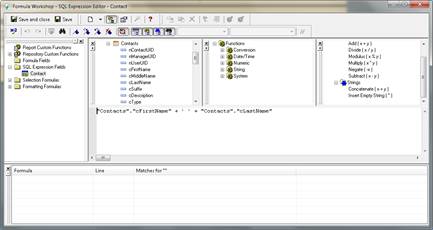
Since the contact consists of two fields, first and last name, we first make a SQL Expression, concatenating the two fields and call it “Contact”.
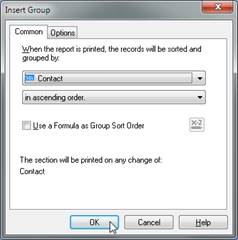
Now select Group… from the Insert menu and select the newly created SQL Expression field, which has been added to the end of the report field list. Select in ascending order from the second dropdown.
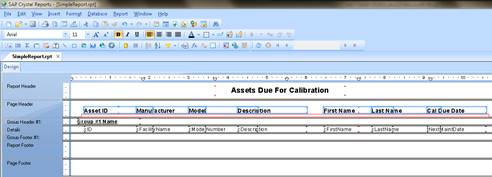
Click OK. In the Design view we will see two new sections: the Group Header #1 and the Group Footer #1. Now we have the contact composite field above the group, but it is not pretty. So let’s right-click on the Group #1 Name field and change the font to underline and bold, via Format Field…. We should also move the page headers up a notch, so that there is some space between the headings and the group headings. To do that, click the column headings one-by-one while holding the CTRL key. When all fields are selected, press the up arrow key, which will move the headings up a notch.
So far we have selected specific information for our report and grouped like information together. The records in each group are not sorted however; they appear in the same order as they appear in the database. Let’s sort our report by due date and model. We can do this in two ways:
·
Click Record Sort
Expert button on the Button Bar
or
·
Select Record
Sort Expert from the Report menu
The Record Sort Expert dialog box appears.
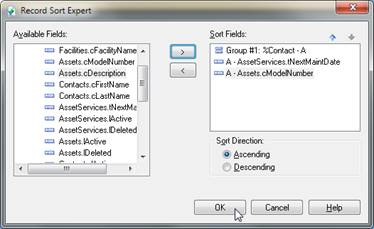
The records are already sorted by the Contact composite field we created via the SQL Expression; now add AssetServices.tNextMaintDate and Assets.cModelNumber to the sort fields as well.
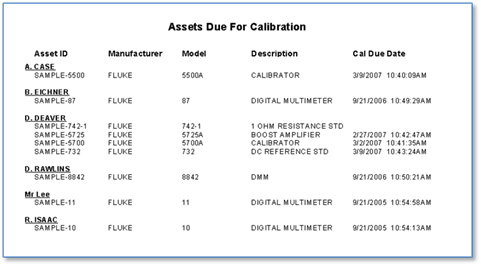
At this point, it makes sense to remove the first and last name columns from the report data since the information is already in the group headers. That way, we can save some real estate and change the page layout to portrait as well.
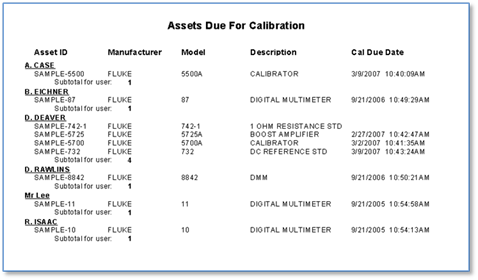
Now our report looks like this:
Now we have a report where we have selected specific information and grouped and ordered that information logically. Let’s assume that we would like to add some summary information (for example a count of Assets Due for Calibration for a given user name). We add summary information into the Group Footer, where Summaries and Subtotals can be inserted.
Note: Crystal Reports allows you to group and
summarize in a single step. We’re using multiple steps to familiarize us with
the fundamentals.
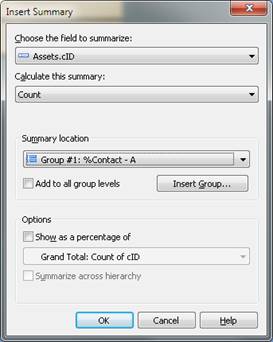
First we highlight the field we want to summarize. If the field is a string field, like Asset Number, then we are going to be inserting a summary such as a count of Asset Number for each user. If we had a numeric field, we would insert a subtotal. Right-click the cID field, select Insert, Summary. The Insert Summary dialog box appears. Select Count from the dropdown for calculating the summary. Select Group # 1 – %Contact - A from the Summary location dropdown. This will also add a grand total to the report footer.
The dialog box will look like this:
Click OK and a number will appear below each user name group. Now put a text field on the report to tell what this number means by selecting Text Object from the Insert menu and typing “Subtotal for User:” into it. Position it in front of the number. Now our report will now look like this:
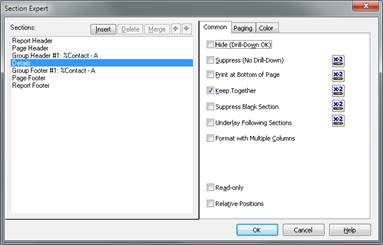
We now have the information we want presented to us on the report. We have selected specific records, grouped records and sorted both records and groups. We have also placed some summary information on the report. We will now look at the formatting options available for entire sections. For example, we may want to insert a page break before each section or hide a section so it doesn’t print.
There are two methods for formatting a section:
·
Right-click on
one of the sections on the left of the Design Window. Select the Section Expert
option.
·
The Section
Expert is also accessible from the Report menu
There is some information that is not in a database but is useful report information such as Report Date and Page Number. In the Field Explorer window on the right hand side of the screen, there is a node called Special Fields and underneath are the available options.
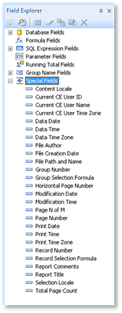
Select Page N of M and place it in the Page Footer.
If we want to make some data stand out or just improve the presentation quality of our report we may wish to highlight it with lines and boxes.
Use one of the following methods to draw a line:
·
Click Insert Line
button
·
Select Line from
the Insert menu
Once you have selected one of the above, you will see a pencil cursor on the screen. Click the left mouse button where you would like the line to be and holding down the mouse button, move to where the line should end and release the mouse button.
·
Click Insert Box
button
·
Select Box from
the Insert menu
Once you have selected one of the above, you will see a pencil cursor on the screen. Click where you want the upper left corner of the box to be. Hold the mouse button and drag the pencil cursor to where the lower right corner should be placed on the report.
Using the above method, draw a line under the headers and a box around the report title.
Our report now looks like this:
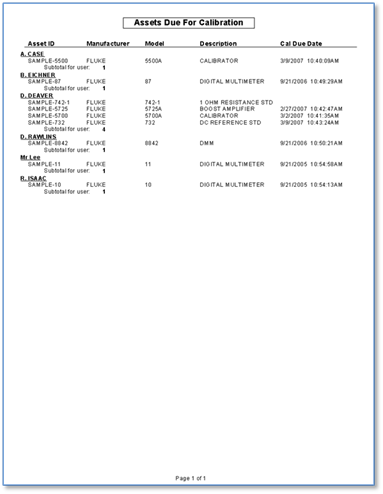
Select Save As… from the File menu and give the report a name, for example Calibrations Due.rpt. We will build upon it in the following sections, so make sure you have a copy of it in this stage, to be able to go back to it later.